I love Economic Trends. Call me a nerd if you’d like but graphs like the one below really rock my world!
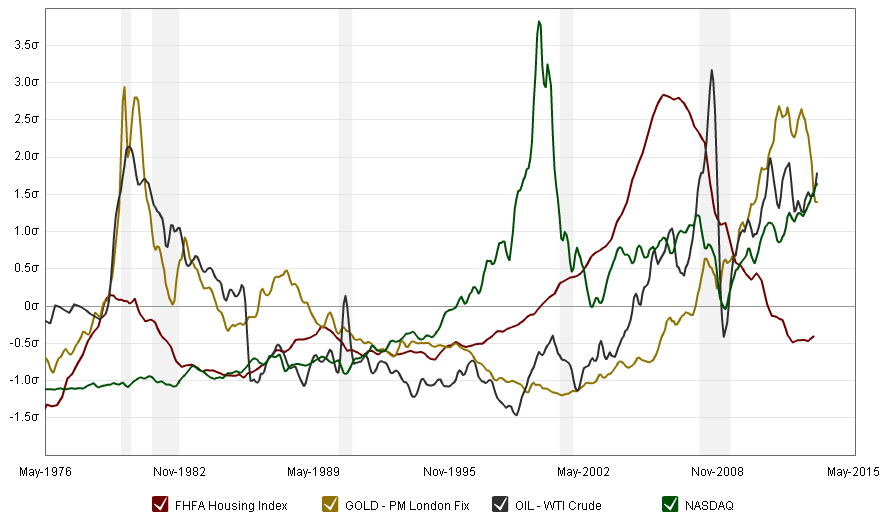
I can tell you a lot about investments from this graph. I can tell you that 1980 was the best year to sell gold, February 1999 was a great time to buy into oil, 2000 was a perfect year to dump stocks before re-buying in 2002 or 2009, and right now is the best time since 1995 to invest in Housing. Of course, I have the benefit of history when I make these statements but I think there is a lot to be gleaned from economic indicators like these. I like to stare at these charts, along with other indicators, and make economic assumptions, which help me perform my role.
If you want to visit this interactive graph as well as other economic indicators, click on it or go to http://www.macrotrends.net/